在学逻辑回归的时候,了解到线性回归的参数,可以使用梯度下降法或正规方程进行求解。
在对数据进行初步的分析的时候,如果能快速对数据进行拟合并对拟合结果进行可视化,可以让我们更好地把握数据的情况。
我用纯Python实现了逻辑回归,后来我发现sklearn包里有方法可以直接对数据进行拟合。
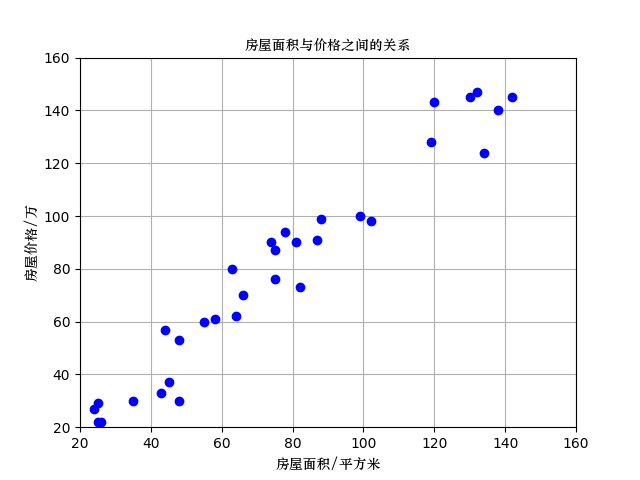
这个例子是使用房价预测的数据,我们先看一下数据。
直接贴代码
import matplotlib.pyplot as plt
from matplotlib.font_manager import FontProperties
from sklearn.linear_model import LinearRegression
font = FontProperties(fname='华文中宋.ttf')
# 数据
a = [[25], [48], [45], [43], [26], [25], [35], [24], [119], [81], [120], [75], [64], [75], [99], [66], [82], [102],
[140], [132], [63], [55], [74], [44], [88], [130], [138], [58], [78], [48], [87], [142], [134]]
b = [[29], [30], [37], [33], [22], [22], [30], [27], [128], [90], [143], [87], [62], [76], [100], [70], [73], [98],
[167], [147], [80], [60], [90], [57], [99], [145], [140], [61], [94], [53], [91], [145], [124]]
model = LinearRegression()
model.fit(a, b) # 训练集数据放入模型中
# 定义plot图标的横纵坐标及标题,这里要注意的是中文字符前加u字母,才能正确显示中文
plt.title(u'房屋面积与价格之间的关系', fontproperties=font)
plt.xlabel(u'房屋面积/平方米', fontproperties=font)
plt.ylabel(u'房屋价格/万', fontproperties=font)
# 定义横纵坐标的范围
plt.axis([20, 160, 20, 160])
plt.grid(True)
plt.plot(a, b, 'bo', c='b')
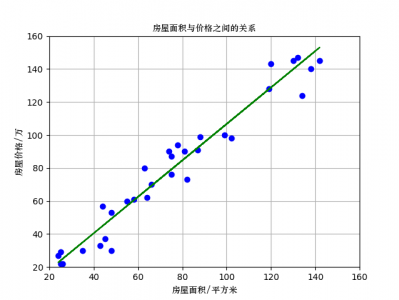
plt.plot(a, model.predict(a), 'g-')
plt.show() 拟合的结果
拟合的结果这里还提供了一个预测的方法
# 房屋价格预测
def PredictPrice(area):
    price = model.predict([[area]])
    return price
在程序中输入PredictPrice(145),得到结果156.39856048
这次数据的简单拟合是使用from sklearn.linear_model import LinearRegression完成的,下次阅读源码,搞清楚里边的原理。
发表回复